How to use this tool
Select a topic from the dropdown menu on the CHNA Data page.
- Each topic corresponds to a category of health indicators.
- Once you are within that health indicator, you will select the service area for which you’d like data.
- Once you select your service area, you’ll choose what measure to examine.
- You’ll then choose which specific indicator for that measure.
- For each indicator, there are two sections: a graph and a map. In most instances, the darker the color the more prevalent the issue.
- On the maps, you can select a ZIP code and data specific to that geographic area will appear.
- Please note that it may take a moment for data to populate on the screen.
How this tool was developed
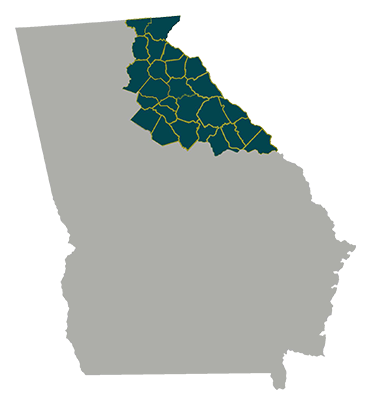
The Northeast Georgia CHNA partners engaged Public Goods Group (PGG) to collect and analyze quantitative data for the CHNA and over 190 public health indicators were examined in each of the communities served by the CHNA partners. Using this data, needs were identified through benchmark analyses, comparing region indicators against Georgia and national values. This Tableau can be used to look at various health and socioeconomic indicators for either the entire Northeast Georgia region or an individual service area. All data reflects the last year for which the data was publicly available, and most data is available at a ZIP code level.
PGG then created this Tableau database to provide an interactive mechanism to explore both the public health data and the community responses to the survey. Through this tool, community members, nonprofit organizations, and other interested groups can access relevant community health and socioeconomic information.
For more information, please contact PGG at info@publicgoodsgroup.com.